  |
| Creating a motion chart with the Data Viewer |
| Product Home | Licensing & Pricing | Metrics Guide | Download Free Trial | FAQ, News, Bugs | Other Products |
|
All of the Professional licensing options (see here for details) include the JHawk Data viewer and the JHawk DataViewer Command line service. The Data Viewer and the Data Viewer Command Line Service both use data data exported to XML files in the JHawk Metric Interchange format. This is a summary of the data collected by JHawk which can be used to reconstitute any of the JHawk metrics. You can find out more about the features of the DataViewer here. On this page we are going to concentrate on using the JHawk Data Viewer (and the JHawk DataViewer Command Line Service) to create motion charts. Motion charts are a useful way to view changes in data over time. This is of particular benefit when we are examining changes in the values of metrics in a body of code over time and we'll show you this using a body of source code. First we want to create the base XML files that we will use to create the motion chart. We can build these simply using the command line. Let's say our body of code is in the directory /source/version
In this case we're going to look at 4 metrics relating to our code - Number of statements (NOS) , Maintainability (MI) , Average Cyclomatic Complexity (AVCC) and our new metric - Review Factor (see more details here). We've chosen these metrics because they are available at package and class level.
Using the interactive Data Viewer is useful if you don't quite know what you want. You might try a number of different criteria (e.g. metrics, different levels (method or class) etc) until you find a representation that suits your needs.
The files that we created using both the dataviewer and the command line are available here - The Demo download includes more documentation relating to the DataViewer. You can download it here. You may be interested in some of our other products. All have demo or trial versions. Just click on the links below to find out more -
Oracle and Java are registered trademarks of Oracle and/or its affiliates. Other names may be trademarks of their respective owners. |
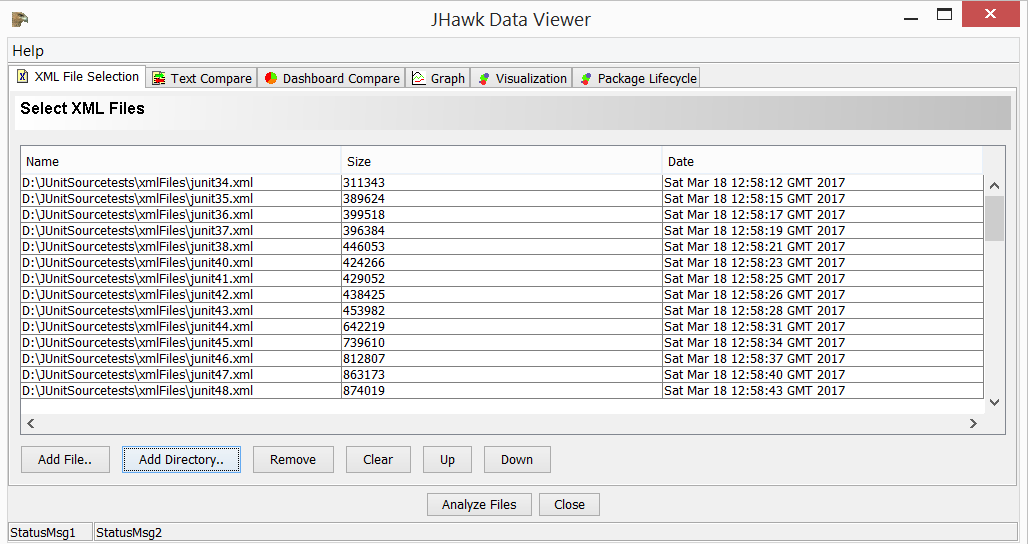 In this example we are going to use the source code of the JUnit open source project. We downloaded the source code and used the JHawk command line as described above to create the initial XML files. This gave us a summary of the metrics for each iteration of the code from JUnit 3.4 to JUnit 4.8 To do the analysis using the JHawkDataViewer we first select the files using the Select files tab. Since we are going to produce the motion chart directly from these files we don't have to analyze the files first.
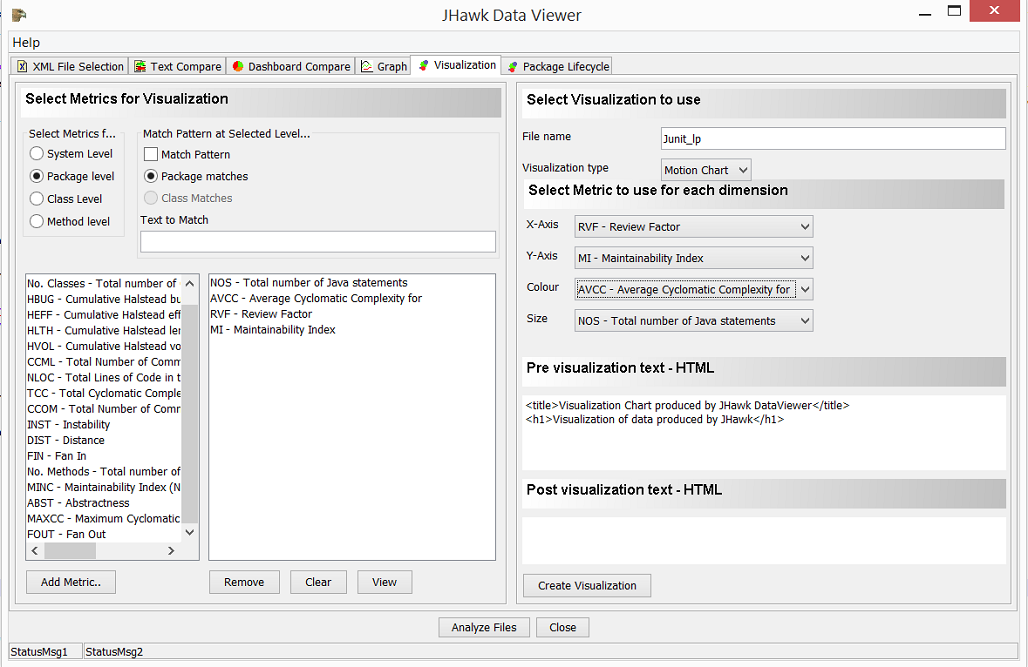 In the Visualization tab we select the metrics that we want, the file name and the style of visualization then we press the 'create Visualization' button. In this case we have selected a package level motion chart for the 4 selected metrics.
|
||||