All of the Professional licensing options (see here for details) include the JHawk Data viewer. The data Viewer uses
data exported to XML files in the JHawk Metric Interchange format. This is a summary of the data collected by JHawk which can be used to reconstitute
any of the JHawk metrics. By importing a number of files you can compare the values of metrics in a body of source code over time.
There are five main tabs in the Data Viewer -
- The File Select tab
- The Text Compare tab
- The Dashboard compare tab
- The Graph Compare tab
- The Visualization tab
The Demo download includes more documentation relating to the DataViewer. You can download it here.
File Select and Analyse
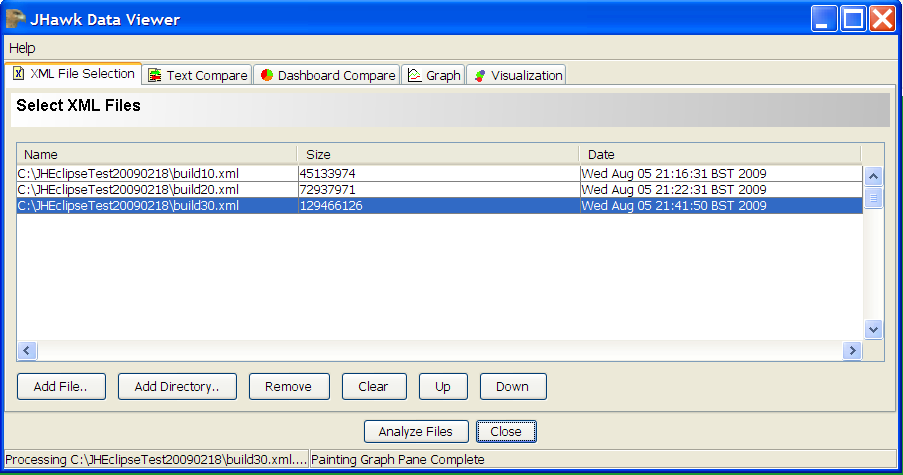 This allows you to select the
Files to be compared in the data viewer. You can select all the files in a directory, add and remove files and alter the order in which
the files are compared.
This allows you to select the
Files to be compared in the data viewer. You can select all the files in a directory, add and remove files and alter the order in which
the files are compared.
The Text Compare tab
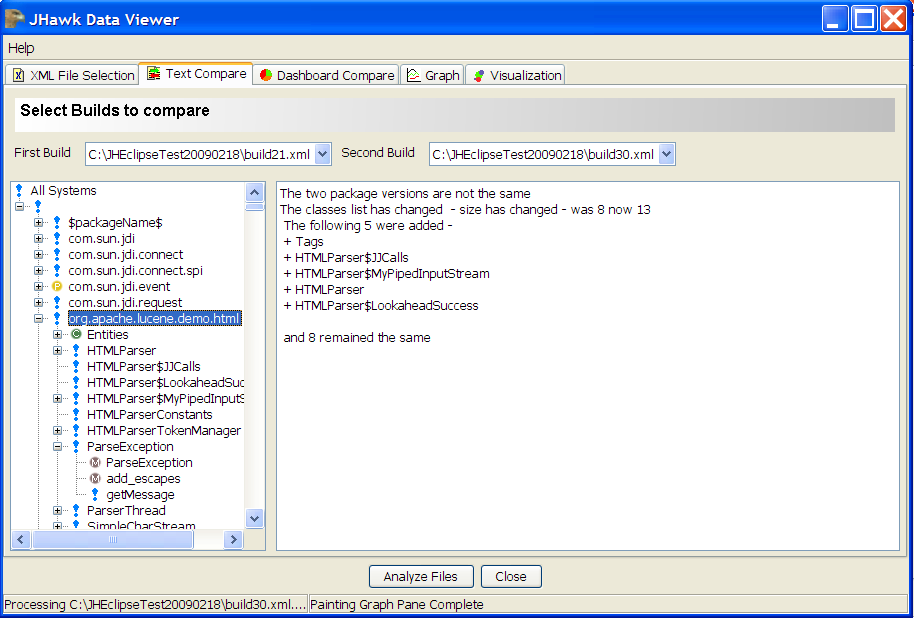 The Text
Compare Tab shows the differences between any two builds in text format. The differences can be viewed at all levels from System down to
Method. You select the two builds to be compared in the drop down boxes at the top. By default the first and last builds are selected
and the differences at System level are shown.
The Text
Compare Tab shows the differences between any two builds in text format. The differences can be viewed at all levels from System down to
Method. You select the two builds to be compared in the drop down boxes at the top. By default the first and last builds are selected
and the differences at System level are shown.
The Dashboard Compare Tab
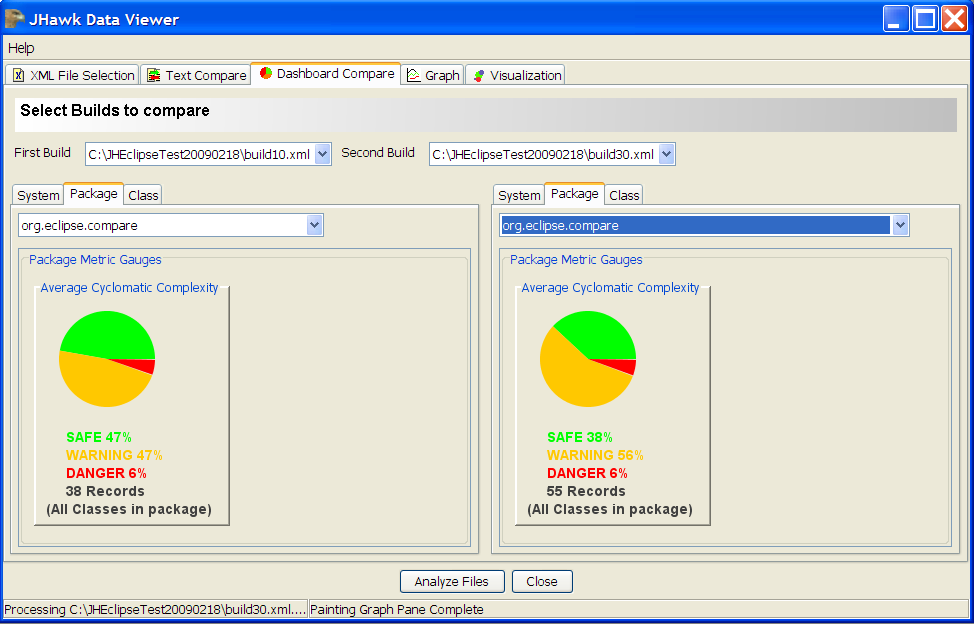 The dashboard compare tab allows you to select two builds and compare them using the dashboard style tabs used in JHawk. By default the
first and last builds are selected and the differences at System level are shown. The Package and Class sub-tabs allow you to select
the package or class whose data you wish to view. If you select a package or class in one tab the data for this will be selected in
the other tab if the data is available.
The dashboard compare tab allows you to select two builds and compare them using the dashboard style tabs used in JHawk. By default the
first and last builds are selected and the differences at System level are shown. The Package and Class sub-tabs allow you to select
the package or class whose data you wish to view. If you select a package or class in one tab the data for this will be selected in
the other tab if the data is available.
The Graph Compare Tab
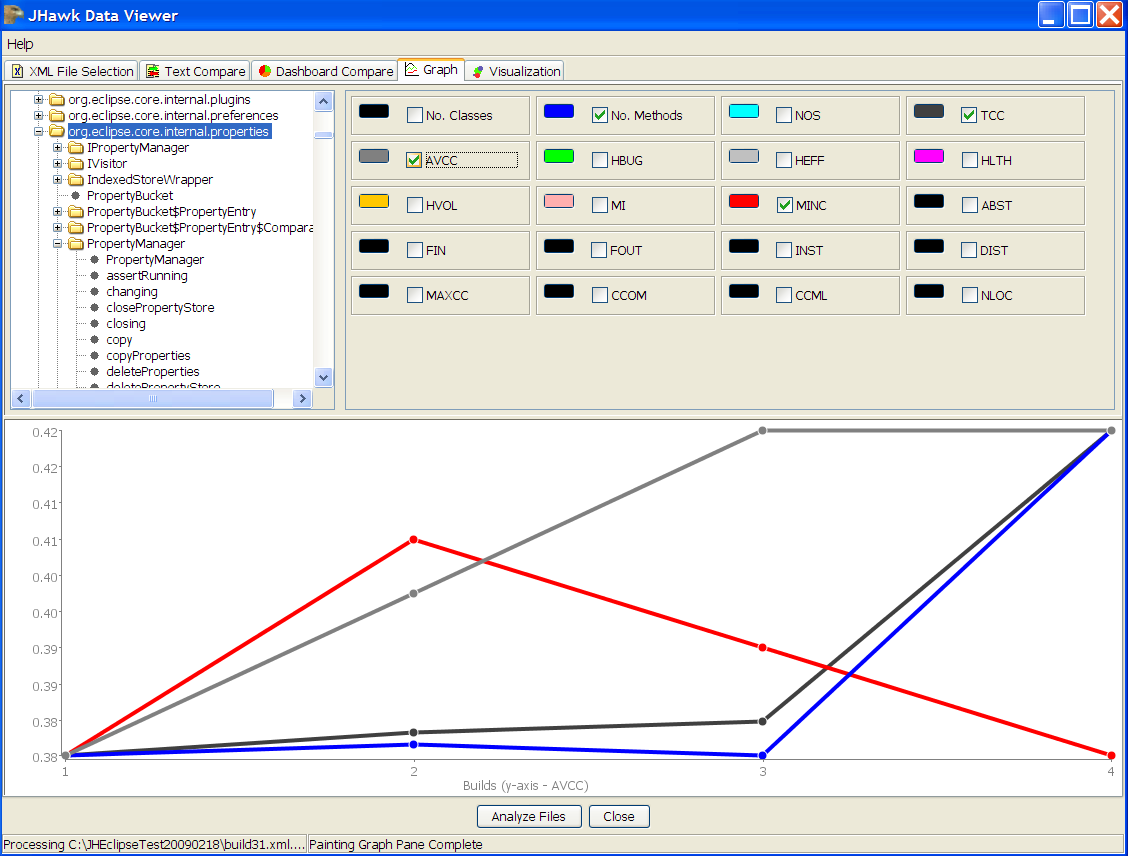 The Graph tab gives a graphical representation of the changes in data over the builds selected for analysis. The Graph and the
available metrics will change according to the level selected in the top left panel. Data will be displayed at System, Package, Class
and Method levels.
The Graph tab gives a graphical representation of the changes in data over the builds selected for analysis. The Graph and the
available metrics will change according to the level selected in the top left panel. Data will be displayed at System, Package, Class
and Method levels.
The Visualization Tab
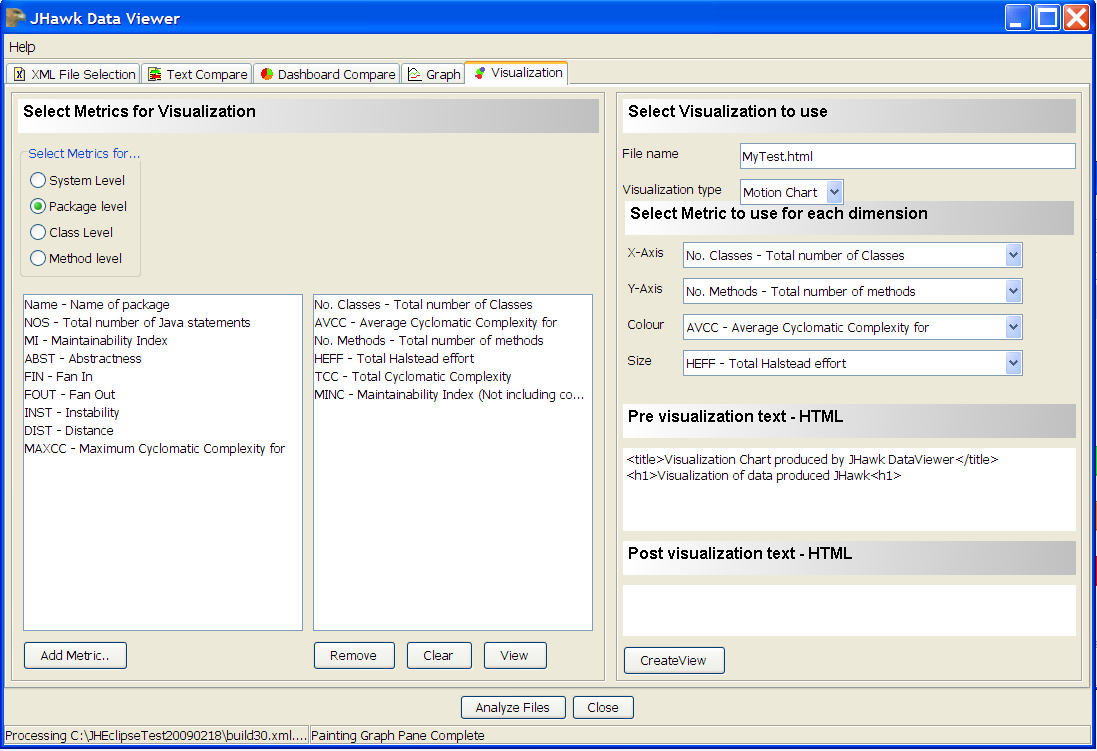 The Visualization Tab allows you to select data for display using Googles Visualization tools.At present both the Motion Chart and
Data Table visualizations are available.
The Visualization Tab allows you to select data for display using Googles Visualization tools.At present both the Motion Chart and
Data Table visualizations are available.
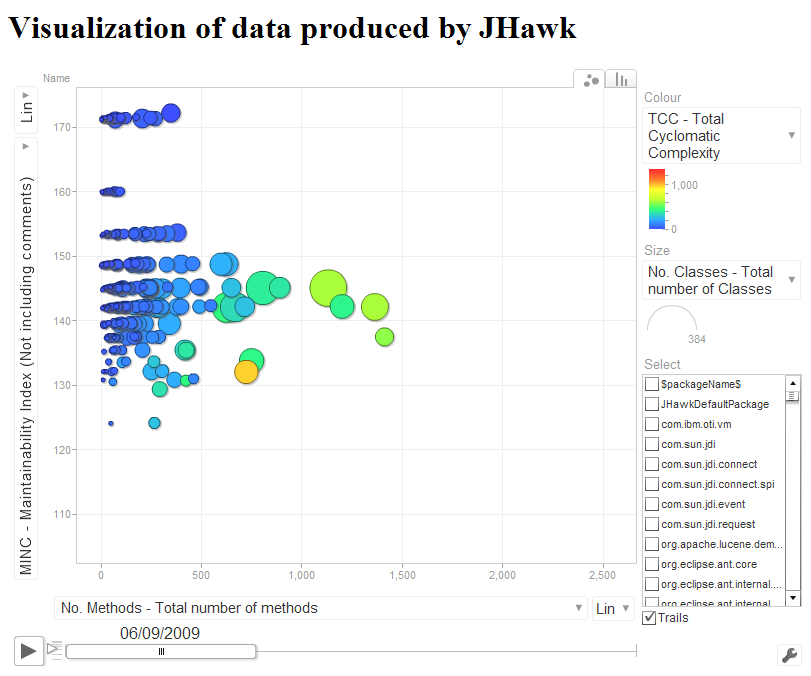 When you have created the HTML using the visualization tab you can then view it using your browser.
The Demo download includes more documentation relating to the DataViewer. You can download it here.
You may be interested in some of our other products. All have demo or trial versions. Just click on the links below to find out more -
Oracle and Java are registered trademarks of Oracle and/or its affiliates. Other names may be trademarks of their respective owners.