 |
JHawk Eclipse Plugin | ||||||
| Product Home | Application | Eclipse Plugin | Command Line | Metrics Guide | Download Free Trial | FAQ, News, Bugs | Other Products |
 JHawk Eclipse Plugin Manual -
Preferences
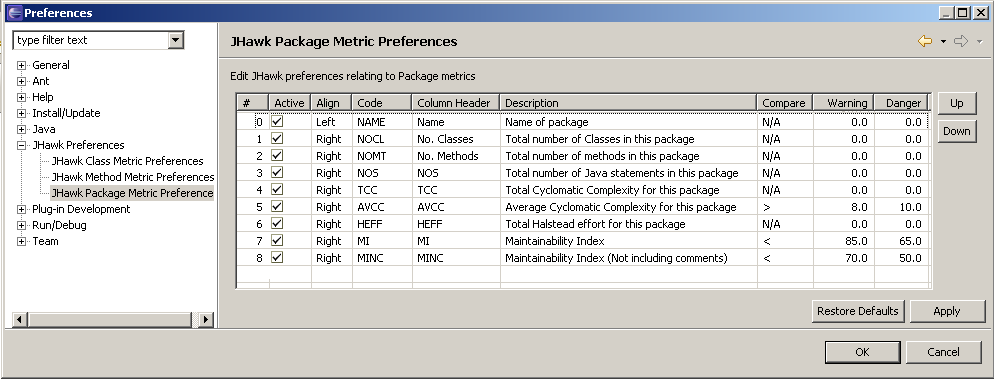
The JHawk Preferences page is available from the standard Eclipse preferences page.There are four main tabs The main preference page provides the following options -
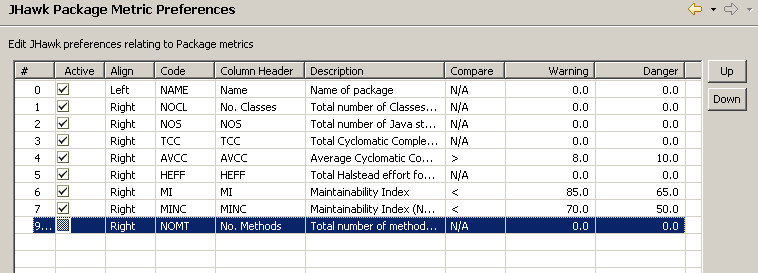
The Package, Class and Method Metric Preference pages all follow the same form so although this section deals only with the Package Metric Preference Page the same principles apply to the other two pages. The image below shows the Package Metric Preference page - The Metric preferences are expressed as a table. The first column , which shows the sequence number, is generated and non-editable. You can change the column order that the metrics are displayed in by using the 'Up' and 'Down' buttons at the right hand side of the table.The second column indicates whether this metric is active (ie displayed as a column in the Package table). You can set a metric as inactive by clicking on it -
The metric is now moved to the bottom of the table and the tick is removed from the tick box. If you want to restore the metric all you need is to click on the 'Active' column for this metric. The tick is placed in the tick box and the metric is assigned the last order in the list -
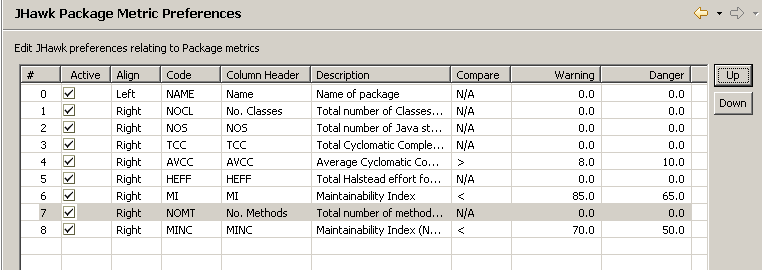
You an move the metric to the column position that you want using the 'Up' and 'Down' buttons -
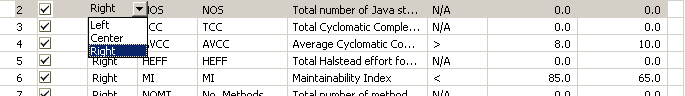
The third column allows you to set the alignment of the column text - there are three options available in a drop-down box - Left, Right or Center - You should choose the one most appropriate to the netric -
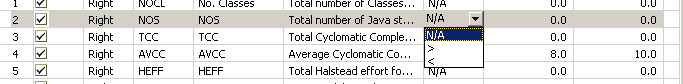
The fourth column is a reference column which notes the internal code of the metric - this field is not editable.The fifth column is the header used at the top of the column when it is displayed in a table. Clicking on this field will allow you to change the text. You can also edit the sixth column which is just a description of the metric. The seventh,eigth and ninth columns relate to the warning and danger levels that you can set for the metrics. The seventh column sets the comparison type ( Greater-than (>) or Less-than (<)) or if set to N/A indicates that the warning/danger levels are not set for this metric. These are set using a drop-down list which will appear if you click on the column entry -
The last two columns set the warning and danger levels for the metric. These are simple numeric entry fields. If you take the Average Cyclomatic Complexity metric shown you will see that it uses the Greater-than (>) comparator and the warning level is set to 8.0 and the danger level to 10.0. This means that values less than or 8.0 will appear in green text (ie the level is normal), values greater than 8.0 but less than 10.0 (warning level) will appear in orange text and values greater than 10.0 (danger level) will appear in red text.
When you have changed the settings and are happy with your changes you can press the 'Apply' button. The changes will not be effective until your next run of the JHawk analyzer. At any time you can restore the default settings by pressing the 'Restore Defaults' button.
Main Preference Page

The Metric preference pages